

As we announced a few months ago, Pico has invested in the integration of Corvil visibility with Redline products InRush and EG. A key component in this integration is Corvil AppAgent, a software library we developed over a decade ago to help clients generate highly accurate timestamps in their application, and to streamline sharing of those timestamps with the Corvil Analytics platform. As part of our work with InRush, our high-performance feed-handler, we re-engineered AppAgent to improve its usability and performance. In particular, we reduced the cost to user threads by approximately 2/3rds and increased its throughput by a factor of 25. During that re-engineering work, we also took the opportunity to reassess the quality of the timestamping it provides. Since precision timestamping provides the foundation for Corvil analytics, we are vigilant about the quality of the timestamps we use, and are always exploring opportunities to broaden the reach of our timestamping capabilities.
The x86 timestamp counter
One technique we have always used in AppAgent to minimize the cost of instrumentation is to generate timestamps from the x86 timestamp counter using the rdtsc family of instructions. This is usually faster than calling clock_gettime(), since the latter needs to execute additional logic to convert the result of TSC read to UTC using clock parameters managed by timing infrastructure provided by, for example, NTP or PTP. That logic is still essential, and raw TSC readings must be converted to UTC before they can be used, but AppAgent defers that logic out of the critical path of the application it is used in. The advantage of using rdtsc is illustrated by the following measurements we recently made: on a HP DL380 Gen10, equipped with a 2.6GHz Ice Lake (Xeon 8358) running RHEL 8.6 (4.18.0 kernel), we measured the following costs per-invocation of the two timestamping methods:
Method Minimum Median Average P99.9
clock_gettime() 19ns 22ns 22ns 25ns
rdtsc 6ns 8ns 11ns 19ns
The x86 TSC provides a simple fast and useful means of generating timestamps, but it is not without its problems:
TSC might run at different frequencies or stop entirely in different CPU power states.
Firmware might rewrite the TSC, such as the BIOS on exit from an SMI to mask the CPU cyles taken when handling the interrupt.
TSC might not be synchronized across cores.
Virtualization introduces multiple additional complexities — TSC might be emulated for guests, which can slow it down significantly, and guests might be migrated across different physical machines with completely different TSC offsets and frequencies.
Modern Intel and AMD x86 processors implement invariant TSC, which avoids the first problem, while Linux can generally undo the tinkering undertaken during SMIs.
This left us with #3 as an important consideration, especially for the design of AppAgent. This uses service thread on a system core that needs to handle TSC readings from threads that may run on a different core or even socket. As a result, we developed a test methodology to assess the synchronization of TSC across cores, applying techniques that we had previously developed for analyzing network time – that is, differences between system clocks on different hosts, and the effectiveness of different network time protocols such as NTP and PTP at keeping clocks in sync.
The basis of such analysis is to run a ping-pong protocol: one process reads a timestamp from its local clock and immediately sends it to a peer which then reads its local clock as soon as it receives the ping. Since those two timestamps are taken from different clocks, which may have different offsets and/or run at different frequencies, they may not be immediately comparable. However, the two timestamps do represent bookends on the process of transferring the ping message. To complete the picture, the peer immediately responds in kind, reading and immediately sending a timestamp, and the first process reads a receive timestamp. By repeating the ping-pong many times, we can apply statistical and modeling techniques to factor out the noise in the transfer latencies and extract an accurate mapping between the two clocks.
Timing protocol inside the CPU
For our work on AppAgent, we were interested in identifying any differences between the x86 timestamp counter across different cores inside a single server. We ran the ping-pong protocol between different threads inside a single process and used the x86 TSC for timestamps, rapidly generating of the order of 20M TSC readings per second per pair of cores. Our first challenge was capturing and analyzing all this data, and our solution was to use AppAgent itself to acquire the ping-pong events and forward them to a Corvil appliance. There, we used Corvil Application Analytics to analyze the data in realtime, capture the results, and create interactive dashboards to explore them.
For each ping-pong round-trip, we can measure two one-way latencies, each one being the difference between the send and receive times. We don’t know prior if the two TSC counter providing the readings are synchronized, or even if they run at the same frequency. The first step in assessing the synchronization is to visualize and summarize the forward and reverse latencies, which we did in a Corvil dashboard, shown in Figure 1.
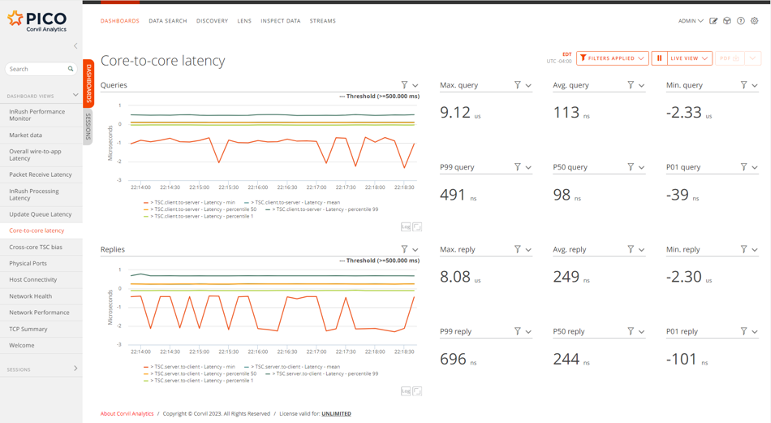
Figure 1. Cross-socket latencies measured using rdtsc.
The dashboard shows a sample of the results for a run across different physical CPU sockets in the form of a two timeseries and aggregated percentiles in big-number form. On top are the results for queries (the initial “pings”), and below are those for the replies to those queries (the resulting “pongs”). The time covered by each time-series chart is five minutes, and the latencies are reported in elapsed time rather than raw TSC differences; this conversion is provided by AppAgent. A few important facts jump out immediately:
The timeseries charts are essentially flat, showing that the TSC counters on the two different CPU sockets are not drifting with respect to each other.
There is significant jitter in the results, with outliers up to 10us (ten microseconds), but the average and medians are very close, both in aggregate and over time.
There is some asymmetry in the results, with query latencies averaging around 100ns and responses somewhat slower at about 250ns.
Perhaps the most interesting observation is that at least 1% of the latencies in both directions are negative, dropping to as low as several microseconds. At first, this might suggest some glitches in the synchronization of TSC across CPU sockets, but the negative latencies still showed up when both threads ran on the same core and hence using the same TSC counter.
That result seemed to indicate a bug in the code: the sending thread cannot send a timestamp from the future, or more precisely the receiving thread cannot receive a TSC reading before the sender has executed rdtsc to generate the reading in the first place. However, a little experimentation proved that it is due to the rdtsc instruction being speculated: although we used the appropriate inline assembly clobbers to prevent the compiler from reordering the TSC read in the code, rdtsc is still susceptible to being executed out of order by the CPU. The standard way of dealing with this problem (link) is to combine rdtsc with other serializing instructions:
following rdtsc with lfence ensures that the TSC is read before any subsequent instructions begin to execute;
rdtscp (essentially rdtsc+cpuid) will not execute before any preceding instructions have completed.
Replacing plain rdtsc with rdtsc+lfence in the sending thread and rdtscp in the receiving thread eliminated all occurrences of negative latencies. In fact, the use of lfence here is not necessary: we still have the causal barrier that the receiving thread cannot read the TSC value generated by the sender until the sender finishes executing rdtsc. The negative latencies were instead caused by the receiving thread speculatively executing rdtsc early, before the load of the sender's TSC value.
Figure 2 shows the results of using rtscp to timestamp receipt of both queries and replies.
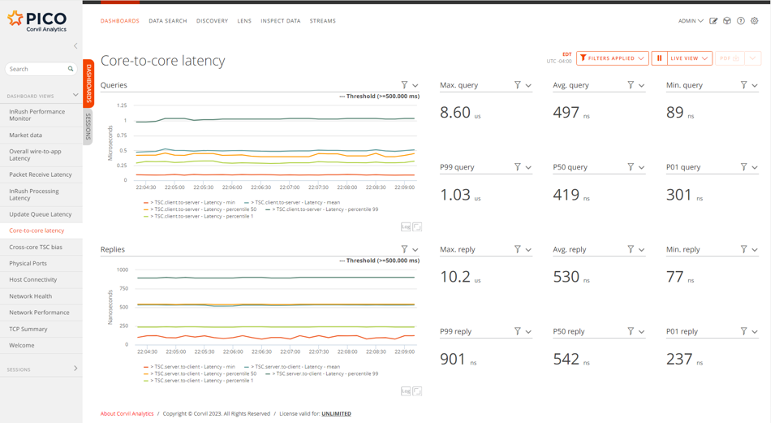
Figure 2. Cross-socket latencies measured using rdtscp (serializing form of rdtsc).
The negative latencies have been eliminated, but the overall latency measurements have increased significantly, especially in the request direction where the median increased more than four-fold from to 113ns to 497ns. These increases are not due to any difference in the actual core-to-core latency – physically nothing has changed – but instead simply reflect the significantly higher cost of the serializing forms of rdtsc.
These measurements quantify an unenviable trade-off:
to get reliable TSC readings, we must pay the cost of flushing the instruction pipeline and the store buffer;
to get fast TSC readings, we must accept that the timestamp may occasionally be subject to substantial errors (up to hundreds of nanoseconds).
One final timeseries illustrates this tradeoff dynamically: Figure 3. Shows the result of switching the application from fast to reliable TSC readings approximately 2/3rds of the way along the time axis (about 22:35:30).
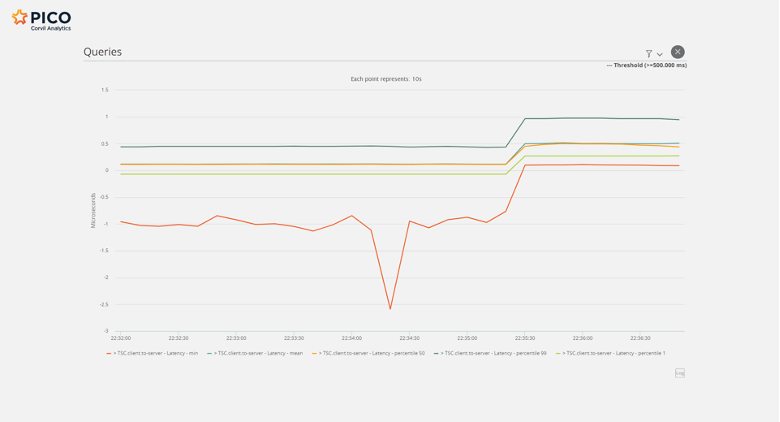
Figure 3. Switching from rdtsc to rdtscp.
We understand that different use-cases will dictate the need to make this trade-off differently, and an application may need to make different choices at different places in the code. As a result, we have also extended the AppAgent API to support the different variants of rdtsc required to ensure its required ordering with respect to the surrounding code.
Summary
Pico has invested significantly in equipping AppAgent to handle market-data rates and further reducing its footprint within applications. We also conducted careful experiments and analysis to ensure that the lowest-cost form of software timestamping (namely rdtsc) can be reliably used by heavily multithreaded applications. Along the way, we used the Corvil analytics platform fed by AppAgent itself to quantify the tradeoff between speed of raw rdtsc and the reliability of its serializing forms. Finally, we have extended the AppAgent API to make those forms readily available to users and allow them to make the tradeoff between accuracy and cost as appropriate for their own instrumentation needs.